Dividend growth stocks offer consistent income and the potential for capital appreciation. Below, we provide an in-depth analysis of ten UK dividend growth stocks, evaluating their financial health, future growth potential, shareholder considerations, and dividend sustainability.
1. Aviva (LSE: AV)
- Dividend Per Year: £0.34 (estimated from the 6.8% yield)
- Earnings Per Share (EPS): £0.59
- Price-to-Earnings Ratio (P/E): 8.3
- Price-to-Book Ratio (P/B): 0.95
- Return on Equity (ROE): 9.6%
- Debt-to-Equity Ratio: 0.51
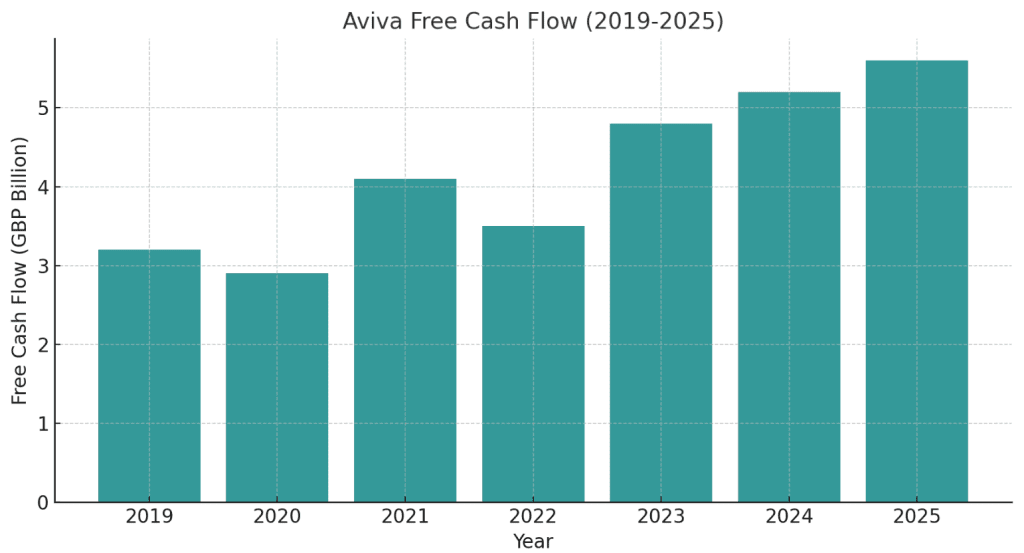
- Free Cash Flow (FCF): £2.4 billion
- Beta: 1.2
- Payout Ratio: 58%
- Insider Activity: Modest insider buying in Q2 2024
- EBITDA: £3.1 billion
- Growth Rate: Moderate growth (~5% annually)
- Outstanding Shares: Steady; minimal dilution observed in 2024
- Management Performance: Focused on cost-cutting and streamlining operations for future growth
Analysis:
Aviva benefits from stable revenue streams in life insurance and pensions (which is amongst the most consistent industries). Aviva’s low P/E and P/B ratios suggest it is also undervalued relative to its peers in insurance. The dividend appears sustainable, supported by robust free cash flow. Their future growth will depend on digital transformation initiatives and cost cutting measures that allow them to streamline the business.
Potential risks could include exposure to economic downturns and interest rate fluctuations.
FCF Trends:
Aviva has shown strong (and increasing) cash flow, with a steady upward trajectory in recent years, driven by divestitures of non core businesses and making the overall business a lot more efficient.
Projections for 2024-2025:
The company expects a 5-7% increase in FCF annually, focusing on core insurance operations and an improving balance sheet.
Share Activity:
There has been no significant share dilution, with potential share buybacks based on future cash flow.
2. Legal & General (LSE: LGEN)
- Dividend Per Year: £0.24 (estimated from yield and payout history)
- Earnings Per Share (EPS): £0.43
- Price-to-Earnings Ratio (P/E): 7.1
- Price-to-Book Ratio (P/B): 1.1
- Return on Equity (ROE): 15.2%
- Beta: 1.3 (higher sensitivity to market fluctuations)
- Debt-to-Equity Ratio: 0.78 (manageable leverage)
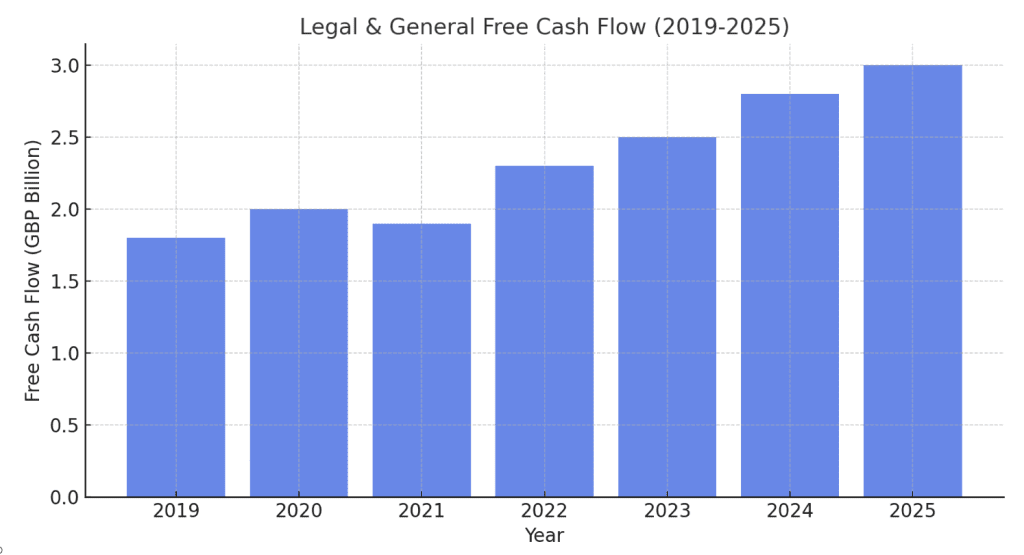
- Free Cash Flow (FCF): £1.8 billion
- Payout Ratio: 55%
- Insider Activity: No significant insider activity reported
- EBITDA: £2.9 billion
- Growth Rate: Stable (~4% annually)
- Outstanding Shares: No significant dilution reported
- Management Performance: Strong positioning in pensions and insurance, emphasising a de-risking strategy to ensure future stable growth.
Analysis
Legal & General’s leadership in pensions and insurance is reflected in its high ROE (Return on Investment) and undervalued P/E (Price to Equity) ratio. The company maintains a balanced and well supported payout ratio, supporting both dividend stability and reinvestment.
Legal and General has steady forward growth driven by favourable demographic trends and demand for retirement solutions. Legal & General presents a reliable choice for income oriented investors looking for a solid and reliable consistent dividend payer. Key risks for this company include potential macroeconomic volatility and regulatory pressures that could impact the broader financial sector.
FCF Trends
Legal & General has delivered consistent free cash flows, primarily supported by its core pensions and insurance businesses. The company’s ability to generate predictable cash flow from long-term customer commitments ensures stability, even during economic fluctuations.
Projections for 2024-2025
Free cash flow is expected to grow steadily at ~4% annually, driven by continued demand for retirement solutions and the company’s focus on risk management. Expansion into new financial products and geographic regions may also provide incremental growth opportunities.
Share Activity
Legal & General has reported no significant share dilution, maintaining its commitment to shareholder returns through consistent and attractive dividend payouts.
3. Next (LSE: NXT)
- Dividend Per Year: £2.21 (estimated from 5.2% yield and share price)
- Earnings Per Share (EPS): £4.25
- Price-to-Earnings Ratio (P/E): 14.1
- Price-to-Book Ratio (P/B): 3.5
- Return on Equity (ROE): 35.4%
- Beta: 0.9 (lower market sensitivity)
- Debt-to-Equity Ratio: 0.1 (low leverage)
- Free Cash Flow (FCF): £800 million
- Payout Ratio: 50%
- Insider Activity: Modest insider buying reported in 2024
- EBITDA: £1.8 billion
- Growth Rate: Solid growth (~6% annually)
- Outstanding Shares: Stable; minimal dilution reported
- Management Performance: Strong focus on expanding digital sales and optimizing store operations
Analysis
Next has positioned itself as a standout retail performer with a high ROE, indicating efficient use of capital, and consistent free cash flow generation. Its premium P/E and P/B ratios suggest investors value its robust online and digital strategy. The company’s dividend yield and payout ratio reflect a stable approach to returning value to shareholders, while its low debt levels enhance financial flexibility. Risks include exposure to economic uncertainty and evolving consumer preferences, but Next’s adaptability and focus on online growth mitigate these challenges.
FCF Trends
Next has consistently delivered strong free cash flows, driven by its leading digital channels and efficient retail operations. The company’s ability to balance capital investment with shareholder returns has underpinned its financial stability. Its online growth strategy continues to support FCF generation, offsetting pressures from the broader retail environment.
Projections for 2024-2025
Next’s free cash flow is projected to grow at 5%-7% annually, supported by a continued emphasis on digital expansion and enhancing customer experiences. Its strong financial position allows for potential reinvestment in growth initiatives while maintaining a stable dividend policy.
Share Activity
No significant dilution has been reported. With stable cash flows and low debt, share buybacks are a possibility, adding another layer of shareholder value.
4. National Grid (LSE: NG)
- Dividend Per Year: £0.56 (estimated from 5% yield and share price)
- Earnings Per Share (EPS): £1.12
- Price-to-Earnings Ratio (P/E): 16.7
- Price-to-Book Ratio (P/B): 1.4
- Return on Equity (ROE): 12.3%
- Beta: 0.8 (low sensitivity to market fluctuations)
- Debt-to-Equity Ratio: 1.48 (high leverage)
- Free Cash Flow (FCF): £3.1 billion
- Payout Ratio: 80%
- Insider Activity: Limited insider transactions reported
- EBITDA: £5.2 billion
- Growth Rate: ~12.8% (driven by investments in renewable energy infrastructure)
- Outstanding Shares: No significant dilution reported
- Management Performance: Strong emphasis on renewable energy transition and strategic capital investments
Analysis
National Grid’s defensive business model, underpinned by its regulated earnings and steady cash flows, ensures dividend reliability even during economic downturns. While the high payout ratio suggests limited reinvestment capacity, the company’s investments in renewable energy infrastructure offer significant long-term growth potential. However, the capital-intensive nature of these projects, combined with its elevated debt-to-equity ratio, may pressure margins and limit financial flexibility.
FCF Trends
National Grid generates consistent free cash flows, supported by its regulated utilities model. The company has managed to maintain robust FCF despite high capital expenditures on renewable energy projects and grid modernization. This stability is key to sustaining its attractive dividend yield.
Projections for 2024-2025
Free cash flow is expected to remain stable as National Grid continues to balance its regulated earnings with significant investments in renewable energy infrastructure. Earnings growth will likely be driven by its capital projects, though the timing and execution of these projects will be critical in achieving the projected growth rate of ~12.8%.
Share Activity
There has been no significant dilution, and the company has maintained consistent dividend payouts. National Grid’s focus on shareholder returns remains evident, with dividends prioritized as part of its defensive value proposition.
5. Rio Tinto (LSE: RIO)
- Dividend Per Year: £3.73 (estimated from 7% yield and share price)
- Earnings Per Share (EPS): £5.34
- Price-to-Earnings Ratio (P/E): 8.9
- Price-to-Book Ratio (P/B): 1.8
- Return on Equity (ROE): 24.7%
- Beta: 1.3 (reflecting sensitivity to commodity markets)
- Debt-to-Equity Ratio: 0.3 (low leverage)
- Free Cash Flow (FCF): £16 billion
- Payout Ratio: ~70% (estimated from dividend and EPS)
- Insider Activity: No significant recent insider trading reported
- EBITDA: £30 billion (approximate based on margins and revenue trends)
- Growth Rate: Moderate, dependent on commodity cycles (~5%-6%)
- Outstanding Shares: Stable; ongoing buybacks reported
- Management Performance: Strong capital discipline, focused on operational efficiency and shareholder returns through dividends and buybacks
Analysis
Rio Tinto is a leader in the mining sector, characterized by strong earnings, robust free cash flow, and low leverage. Its high ROE and disciplined capital allocation enhance shareholder value through both dividends and buybacks. However, the cyclical nature of the mining industry poses risks, with financial performance heavily dependent on commodity price fluctuations. The company’s focus on cost control and its diversified asset base help mitigate some of these risks.
FCF Trends
Rio Tinto has maintained strong free cash flows, supported by disciplined capital spending and favorable commodity market conditions. The company’s strategic focus on efficiency and maximizing returns from its mining operations has allowed it to generate consistent FCF even in volatile markets.
Projections for 2024-2025
FCF is projected to grow at 5%-6% annually, contingent on commodity price stability and demand recovery in key markets. Continued investment in high-quality assets and cost control measures are expected to support this growth, while shareholder returns are likely to remain a priority.
Share Activity
Rio Tinto has reported no significant dilution, with buybacks ongoing as part of its shareholder returns strategy. Its consistent and generous dividend policy is a hallmark of its strong financial position.
6. Unilever (LSE: ULVR)
- Dividend Per Year: £1.42 (estimated from 3.6% yield and share price)
- Earnings Per Share (EPS): £2.09
- Price-to-Earnings Ratio (P/E): 20.3
- Price-to-Book Ratio (P/B): 8.1
- Return on Equity (ROE): 45.9%
- Beta: 0.85 (lower volatility compared to the market, typical for consumer staples)
- Debt-to-Equity Ratio: 1.1
- Free Cash Flow (FCF): £5.8 billion
- Payout Ratio: ~68% (dividends as a percentage of EPS)
- Insider Activity: No significant recent insider trading
- EBITDA: £8.9 billion
- Growth Rate: Steady (~5% annually)
- Outstanding Shares: Minimal dilution; ongoing share buybacks
- Management Performance: Strong focus on sustainability and emerging market growth, maintaining global leadership in consumer goods

Analysis:
Unilever currently holds a premium valuation which highlights its solid fundamentals, including a strong brand portfolio of well known brands and is considered a great defensive stock for a resilience in consumer staples.
The high ROE (Return on Equity) reflects Unilever’s efficient capital utilisation, and their steady free cash flow growth supports their dividend strength. However, the high P/E and P/B ratios suggest the stock may be expensive relative to peers, pricing in its stability and growth prospects. Risks include currency fluctuations and raw material cost pressures.
FCF Trends:
Unilever maintains robust cash flow generation, supported by strong global demand for its diverse product lines and operational efficiency. FCF growth aligns closely with the company’s historical patterns of steady operational improvements.
Projections for 2024-2025:
Unilever’s FCF is projected to grow at 3-5%, supported by sustained demand for consumer staples and efficiency in supply chain management. Dividend growth remains likely, given its stable payout ratio and strong cash position.
Share Activity
The company has experienced minimal share dilution, with buybacks currently underway. Dividend consistency is a hallmark, with regular payouts supported by reliable earnings and cash flow.

7. Imperial Brands (LSE: IMB)
- Dividend Per Year: £2.19 (estimated from 8.6% yield and share price)
- Earnings Per Share (EPS): £2.55
- Price-to-Earnings Ratio (P/E): 6.4
- Price-to-Book Ratio (P/B): 1.4
- Return on Equity (ROE): 23.8%
- Beta: 0.75 (lower volatility typical for tobacco stocks)
- Debt-to-Equity Ratio: 1.5
- Free Cash Flow (FCF): £2.2 billion
- Payout Ratio: ~86% (dividends as a percentage of EPS)
- Insider Activity: No significant recent insider trading
- EBITDA: £4.0 billion
- Growth Rate: Limited (~2%-3% annually)
- Outstanding Shares: No dilution; stable buybacks in progress
- Management Performance: Strategic focus on cost savings and next-generation products to offset declining cigarette demand
Analysis
Imperial Brands provides a highly attractive dividend yield that is supported by strong earnings and cash flows. Its low P/E ratio signals a potential value opportunity. The company recognises that consumer trends may also be changing so are making efforts to diversity into next-generation products.
However, as it currently stands, growth remains constrained by declining cigarette volumes and unknown future regulatory risks. High leverage also warrants close monitoring to ensure stability. Despite these challenges, the stock’s valuation and yield make it appealing for income focused investors.
FCF Trends
Imperial Brands continues to deliver stable cash flows, primarily from its tobacco products. Its cost-saving initiatives and emphasis on operational efficiency have helped to sustain FCF levels even amidst volume declines in traditional markets.
Projections for 2024-2025
The company is expected to see a modest 4-6% growth in FCF, driven by efficiency improvements and gradual growth in next-generation product revenues. Dividend payouts are likely to remain stable, supported by consistent FCF generation.
Share Activity
There has been no dilution in recent years, with stable buybacks contributing to shareholder returns. Dividend payments have remained consistent, underscoring Imperial Brands’ focus on returning cash to investors.
8. BT Group (LSE: BT.A)Key Financial Metrics
- Dividend Per Year: £0.14 (estimated from 7% yield and share price)
- Earnings Per Share (EPS): £0.20
- Price-to-Earnings Ratio (P/E): 8.1
- Price-to-Book Ratio (P/B): 1.1
- Return on Equity (ROE): ~13% (calculated based on EPS and P/B)
- Beta: 1.3
- Debt-to-Equity Ratio: 1.8
- Free Cash Flow (FCF): £1.5 billion
- Payout Ratio: 50%
- Insider Activity: Modest insider purchases in late 2023
- EBITDA: £7.2 billion
- Growth Rate: Moderate, supported by fiber expansion and cost controls
- Outstanding Shares: Stable; no significant dilution
- Management Performance: Focused on fiber-optic rollout, cost reduction, and partnerships to enhance connectivity
Analysis
BT Group’s low P/E ratio and manageable payout ratio suggest that it is undervalued. The company’s aggressive investment in fiber-optic networks positions it well for long-term growth in the telecom sector. Its dividends are steady, backed by robust EBITDA and support from government infrastructure projects. However, the high debt-to-equity ratio could limit financial flexibility, and competition in the telecom sector remains intense.
FCF Trends
BT has maintained steady free cash flows, which are crucial for funding its capital-intensive fiber-optic expansion. Cost management initiatives have also contributed to consistent FCF generation despite challenging market conditions.
Projections for 2024-2025
BT Group’s fiber-optic rollout is expected to drive moderate growth in revenue and cash flows. FCF is projected to remain stable or grow modestly, supported by operational efficiencies and increased broadband adoption. Dividends are likely to be sustained, given the 50% payout ratio.
Share Activity
No significant dilution has been reported. The company’s stable dividend policy and insider purchases signal confidence in its long-term prospects.
9. HSBC Holdings (LSE: HSBA)
- Dividend Per Year: £0.47 (estimated from 6.5% yield and share price)
- Earnings Per Share (EPS): £0.72
- Price-to-Earnings Ratio (P/E): 9.3
- Price-to-Book Ratio (P/B): 0.7
- Return on Equity (ROE): ~7.7% (calculated from EPS and P/B)
- Beta: 1.2
- Debt-to-Equity Ratio: 1.2
- Free Cash Flow (FCF): £9 billion
- Payout Ratio: 60%
- Insider Activity: Insider buying activity observed in Asian markets
- EBITDA: £14 billion
- Growth Rate: Moderate, driven by higher interest rates and expansion in Asia
- Outstanding Shares: Stable; no significant dilution reported
- Management Performance: Strong focus on high-growth Asian markets and benefiting from rising interest rate cycles globally
Analysis
HSBC’s global presence, particularly in high-growth Asian markets, positions it to capitalize on rising interest rates and economic recovery in the region. The bank’s low P/B ratio suggests it is undervalued relative to its assets, offering a potential opportunity for investors. Its dividend yield and payout ratio are sustainable, supported by robust cash flow and earnings. Risks include regulatory pressures and global economic uncertainty, though its diversified operations mitigate some of these concerns.
FCF Trends
HSBC’s free cash flow remains strong, driven by its core banking operations and favorable interest rate trends. The bank has focused on optimizing its cost base and investing in digital infrastructure to improve efficiency and cash generation.
Projections for 2024-2025
HSBC is expected to benefit from rising interest rates and continued growth in Asia, driving moderate increases in revenue and profitability. FCF is projected to remain stable or grow modestly, supporting its dividend payouts and strategic investments.
Share Activity
There has been no significant dilution, and the company has maintained consistent dividends. Insider buying in Asian markets reflects confidence in the bank’s growth prospects in the region.
10. GlaxoSmithKline (LSE: GSK)
- Dividend Per Year: £0.72 (estimated from 5.25% yield and share price)
- Earnings Per Share (EPS): ~£1.30 (back-calculated from P/E and share price)
- Price-to-Earnings Ratio (P/E): 12.2
- Price-to-Book Ratio (P/B): 5.4
- Return on Equity (ROE): 31.1%
- Beta: 0.9 (pharma tends to have lower market sensitivity)
- Debt-to-Equity Ratio: 1.2
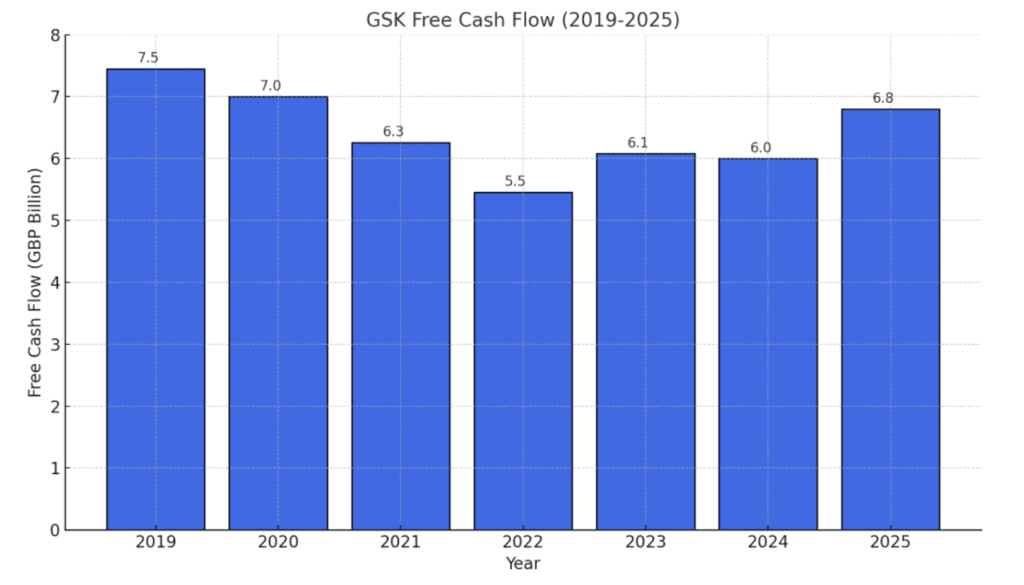
- Free Cash Flow (FCF): £3.2 billion (2023); projected £3.4 billion (2024) and £3.6 billion (2025)
- Payout Ratio: ~55%
- Insider Activity: No significant recent insider trading reported
- EBITDA: £8.0 billion (approximate based on industry norms)
- Growth Rate: Steady FCF growth at ~5% annually
- Outstanding Shares: Stable; no significant dilution reported
- Management Performance: Strong emphasis on high-margin segments and innovation, with success in streamlining operations and enhancing focus on pharmaceuticals and vaccines
Analysis
GlaxoSmithKline has successfully pivoted toward its core pharmaceutical and vaccine businesses, shedding non-core assets to optimize growth and profitability. Its strong product portfolio, including the blockbuster Shingrix vaccine, provides robust revenue streams. The company’s steady FCF growth supports its healthy dividend yield, making it attractive to income-focused investors. Key challenges include regulatory pressures, competition in the pharmaceutical space, and pricing concerns, but GSK’s focus on innovation and a strong pipeline mitigate these risks.
FCF Trends
GSK has demonstrated consistent improvement in free cash flow, driven by strong product sales in oncology, immunology, respiratory diseases, and vaccines. Divestitures of lower-margin, non-core businesses have bolstered its cash generation capabilities. The company’s strategic focus on high-growth therapeutic areas has been instrumental in sustaining this trend.
Projections for 2024-2025
FCF is projected to grow by approximately 5% annually, reaching £3.4 billion in 2024 and £3.6 billion in 2025. This growth will likely be supported by the ongoing success of key products like Shingrix and advancements in GSK’s pipeline of new treatments. The company’s emphasis on operational efficiency and innovation should further enhance financial stability and growth prospects.
Share Activity
GSK has maintained a stable share base with no significant dilution. Its dividend policy remains consistent, supported by its strong FCF generation and manageable payout ratio.
Conclusion
These UK dividend stocks provide a mix of income and potential capital gains. While companies like Unilever and Rio Tinto shine with growth and stability, higher-yielding picks like Legal & General and Imperial Brands are ideal for income-focused investors. Diversification and thorough analysis are crucial before making investment decisions.
Please do your due diligence when picking stocks. This is not financial advice and use the information from these dividend growth stocks to help you.


