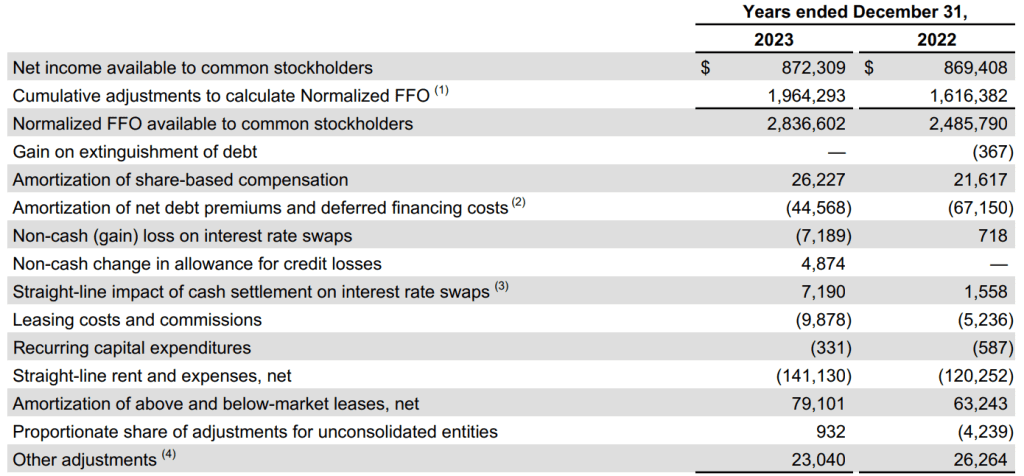
Funds From Operations (FFO) and Adjusted Funds From Operations (AFFO) created by the National Association of Real Estate Investment Trusts (NAREIT) as a way of analysing and understanding the financial health, and the ability of a REIT to generate cash flow.
For investors, FFO and AFFO are useful tools to help you decide whether a REIT is undervalued or overvalued relative to its current share price. I have created this useful FREE FFO and AFFO calculator to better equip you to make better financial investments.
Funds From Operations (FFO)
What it is:
FFO is a measure of a REIT’s core operating performance, focusing on the cash generated from its property investments. FFO begins with the net income but excludes non-cash expenses like depreciation and gains, or losses from property sales. Why? depreciation does not actually impact a REITs ability to generate cash unlike a stock. So, by excluding depreciation, FFO can give you a clearer picture of the cash flow that the REIT is actually producing.
Where to find it:
You can usually find FFO in a REIT’s financial statements, sometimes explicitly mentioned in the income statement or in the “Funds From Operations” section of the investor relations page.
The FFO Formula:
FFO =

Net Income + Depreciation + Amortisation + Losses on Sales of Asset - Gains on Sales of Assets - Interest Income
Net Income = The REIT’s profit, found at the bottom of the income statement.
Depreciation = The expensed portion of the REIT’s tangible assets, such as buildings and properties. Even though buildings typically appreciate in value, accounting rules require that their value is depreciated over time.
- E.g. the depreciation of a purchase of a machine for $100,000
- Year 1, $10,000
- Year 2-10, $10,000 per year
Amortisation = The expensed portion of the REIT’s intangible assets, like leasing commissions and tenant improvements. These costs are spread out over their useful life.
- Leasing commissions
- Tenant property Improvements
It will measure the expense cost in relation to the revenue the property will generate over time to provide a more accurate image of a REITs financial performance.
Losses on Sales of Assets (Property Sales Adjustment): Any losses incurred from selling properties.
Gains on Sales of Assets: Any gains made from selling properties.
Interest Income: Income earned from interest, which is subtracted because it’s not part of the regular cash flows of the REIT.
Example Calculation of FFO
Lets try this FFO calculation with an example REIT (Prologis) using their income statements:
- Net Income: $3,05 billion
- Depreciation & Amortisation: $200,000 + $100,000 = $300,000
- Losses on Sales of Assets: $50,000
- Gains on Sales of Assets: $150,000
- Interest Income: $20,000
Now, using the information gathered, lets try to apply these figures using the FFO analysis.
FFO = $3,005,000,000 + $300,000 + $50,000 − $150,000 − $20,000

FFO = $3.23 billion ($3,230,000,000)
Adjusted Funds From Operations (AFFO)
What it is:
AFFO is a generally considered a better measure of a REITs performance than FFO. It goes a step further by taking the FFO and adjusting for capital expenditure (CapEx) and other non-recurring items that could affect the REITs ability to generate cash in the future. FFO fives you an idea of operating cash flow, while AFFO provides a more accurate image of the actual cash flow that would be left over for a REIT to reinvest or pay dividends.
In simple terms, this indicator tells you the “real” cash flow after accounting for ongoing maintenance costs.
Where to find it:
It isn’t always listed directly in financial reports, but you can calculate it by starting with FFO and subtracting estimated CapEx and other adjustments.
The AFFO Formula:
AFFO =
FFO − Recurring Capital Expenditures − Straight-line Rent Adjustments − Leasing Costs and Improvements
FFO = As mentioned earlier, we start with this as a basis for working out the AFFO.
Recurring Capital Expenditures: Also referred to as “CapEx”, these are the incurred costs required in order to maintain and improve the real estate. It is essentially a maintenance fee for keeping the properties in good working order.
- E.g. if a REIT spends $200,000 to replace the roof of a building, or expansion of a property.
- This cost would be spread over the useful life of the roof.
Straight-line Rent Adjustments: This adjustment accounts for any differences between actual cash rents received and the average rent over the lease term. It helps to smooth out rent income over the life of the lease.
- E.g. if a tenant pays lower rent in the first year and higher rent in subsequent years,
- The average rent is used to even out the income.
Leasing Costs and Improvements: These include costs associated with acquiring new tenants and making improvements to properties for tenants. Examples include broker commissions and tenant improvement allowances.
- E.g. if a REIT spends $50,000 on broker commissions to lease out a property
- This cost would be included in the calculation.
Example Calculation of AFFO
Lets try this calculation with an example REIT (Simon Property Group) using their income statements:
- FFO (Funds From Operations): $4.5 billion
- Recurring Capital Expenditures: $300 million
- Straight-line Rent Adjustments: $60 million
- Leasing Costs and Improvements: $150 million
Now, using the information gathered, lets try to apply these figures using the AFFO analysis.
AFFO = $4.5 billion − $300 million − $60 million − $150 million = $3.99 billion

AFFO = $3.99 billion ($3,990,000,000)
Why Both Metrics Matter
Key Benefits:
| Metric | What It Means for You |
|---|---|
| FFO | Focuses on core cash generation, ignoring non-cash depreciation. Helps you understand the operating strength of a REIT. |
| AFFO | Provides a more accurate view of cash available for reinvestment or dividends, adjusting for capital expenditures and one-time items. |
Pro Tip: When evaluating REITs, FFO is great for getting a quick snapshot of operational cash flow, while AFFO is better for understanding how much cash the REIT can actually distribute or reinvest back into the company.
REIT FFO & AFFO Calculator
Peer Comparison
Feel free to check out the other tools for evaluating and analysing stocks.
If you liked this calculator, check out the other ones I made:


